U.S. production of pumpkins rose by over 30 percent from 2000 to 2014, reflecting rising demand for pumpkins destined for both ornamental and food use. The Economic Research Service has created a special web page on pumpkin background information and statistics.
In the fall a person’s fancy often turns to thoughts of…pumpkins. The season is underway, from the ornamental pumpkins of Halloween to the pies that grace many tables at Thanksgiving and Christmas.
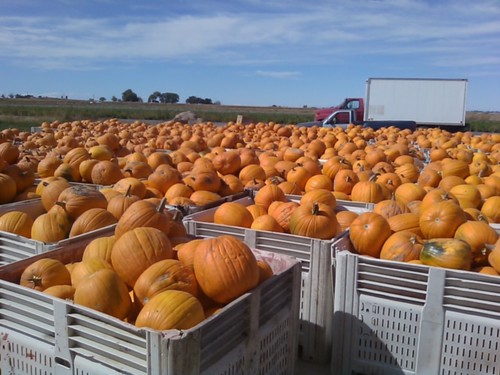
Where do pumpkins come from? Though six States account for nearly half of U.S. production, pumpkins are grown in virtually every State of the union. This is important to consider in light of recent media reports of a looming pumpkin shortage.
Reports of “the great pumpkin shortage of 2015” cite heavy rains during the planting season in central Illinois as the culprit. Illinois is the top producing State, and most of its output is processed (think canned pumpkin for pies). So the concern this year is for Thanksgiving rather than for Halloween. Illinois’ Tazewell County is the top producer of pumpkins in the United States. And the town of Morton, near Peoria, home to a huge canning facility, is the (self-proclaimed) Pumpkin Capital of the World.
While data are not yet available on the size of the 2015 U.S. pumpkin crop, the production of pumpkins is widely dispersed. (And like this year, occasional alerts on pumpkin shortages over the years have been attributed to weather conditions in specific areas of the country.)
Meanwhile, consumers have been buying more pumpkins over the past decade, in both fresh and processed form. U.S. production of pumpkins for all uses rose 31 percent – from 1.46 billion pounds in 2000 to 1.91 billion pounds in 2014 – reflecting rising demand for ornamental and food-use pumpkins. Per capita annual use (adjusted for feed use, shrinkage, and marketing loss) rose from 4.6 pounds to 5.4 pounds during the same period. Demand for specialty pumpkins in particular has expanded. With names like Big Mack, Cinderella, and Knucklehead, and the heirloom pumpkins, these varieties are available in alternative skin textures and in colors such as green, white, and yellow/green stripes. Food uses such as pumpkin-flavored coffees and seasonal beers are also gaining popularity.
This year, as in previous years, the Economic Research Service (ERS) has posted a special web page assembling information and data on pumpkins. Journalists – and other interested users – can grab background information like the farm value of pumpkins over several years, production volume and yield in the top six States, and recent wholesale and retail prices. At ERS, this web resource is one sign of the season.
No comments:
Post a Comment
Note: Only a member of this blog may post a comment.